1. Three Physical Features of the Lower Catchment
The lower catchment of the Brisbane River is shaped by three physical features that strongly influence what the city experiences when extreme rain falls across the region.[1]
Feature 1: A Large Upstream Catchment
The Brisbane River's catchment is immense, covering approximately 15,000 square kilometres. To put this in perspective, this area is roughly the same size as the entire nation of East Timor. When rain falls anywhere within this vast basin—from the Great Dividing Range in the west to the D'Aguilar Range in the north—it eventually finds its way into the main river channel that bisects the city.
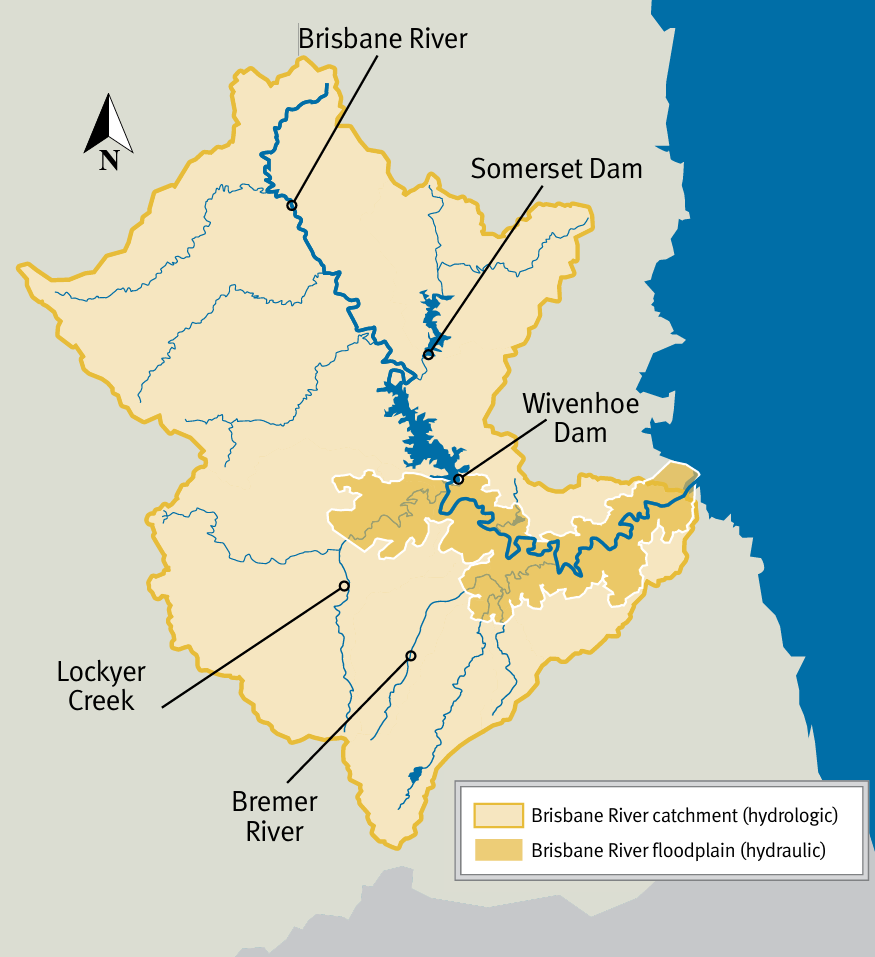
Feature 2: Major Tributaries Downstream of Storages
Brisbane relies heavily on major infrastructure like Wivenhoe Dam for flood mitigation. However, roughly half of the entire catchment lies below Wivenhoe and Somerset Dams. Most critically, major tributaries such as Lockyer Creek and the Bremer River join the Brisbane River downstream of these storages.
This physical reality means that if a weather system parks over Ipswich or the Lockyer Valley, the resulting floodwaters cannot be intercepted by the region's primary dams.
Feature 3: Tidal Influence
The Brisbane River is a tidal estuary. Tidal effects extend inland for over 80 kilometres, as far as Mount Crosby. During a severe weather event, this phenomenon—known as tidal backing—forces the river to battle against the incoming ocean tide.
If the peak discharge of floodwater coming downstream coincides with a high astronomical tide (or worse, a storm tide), the river has nowhere to drain, causing water to back up and spill over its banks in inner-city suburbs.
2. The Three Climate Drivers
Several large-scale climate and weather patterns interact with the physical geography of the basin to influence flood risk in Queensland.
Driver 1: La Niña and ENSO
The El Niño–Southern Oscillation (ENSO) is a primary driver of Australia's year-to-year climate variability. During a La Niña event, warmer waters in the western Pacific push increased moisture toward eastern Australia, significantly increasing the likelihood of widespread, prolonged rainfall.
Both the catastrophic 2011 and 2022 Brisbane floods occurred during robust La Niña periods. In 2022, consecutive La Niña years meant the catchments were already deeply saturated before the fatal February rainfall even began.
Driver 2: Tropical Cyclones
Ex-tropical cyclones are infamous for carrying immense volumes of atmospheric moisture southward from the tropics. The devastating 1974 flood was heavily influenced by the arrival of Cyclone Wanda, which dumped over 600mm of rain on the city in just 36 hours.
Driver 3: Monsoon Troughs
Perhaps the most insidious driver is the slow-moving monsoon trough. Unlike a fast-moving storm, a monsoon trough or slow-moving upper low can "park" over South East Queensland for days.
3. Antecedent Conditions
The combination of these physical and climatic features highlights the critical importance of antecedent conditions. When consecutive La Niña years completely saturate the soil, a relatively moderate, slow-moving low can trigger catastrophic overland flow and riverine swelling, entirely bypassing the design limits of infrastructure.