To understand flood risk in South East Queensland, we must look at the historical record. Over the past 130 years, four benchmark events have forced the city of Brisbane to redefine its relationship with the water.

A look at the Brisbane City Gauge records presents an interesting paradox. The peak flood heights have steadily decreased over time—but the human and economic impact has simultaneously widened.

The paradox of Brisbane flooding: the lowest gauge peak in modern history (2022) flooded the most properties.


1893 — "Black February"

The Great Flood

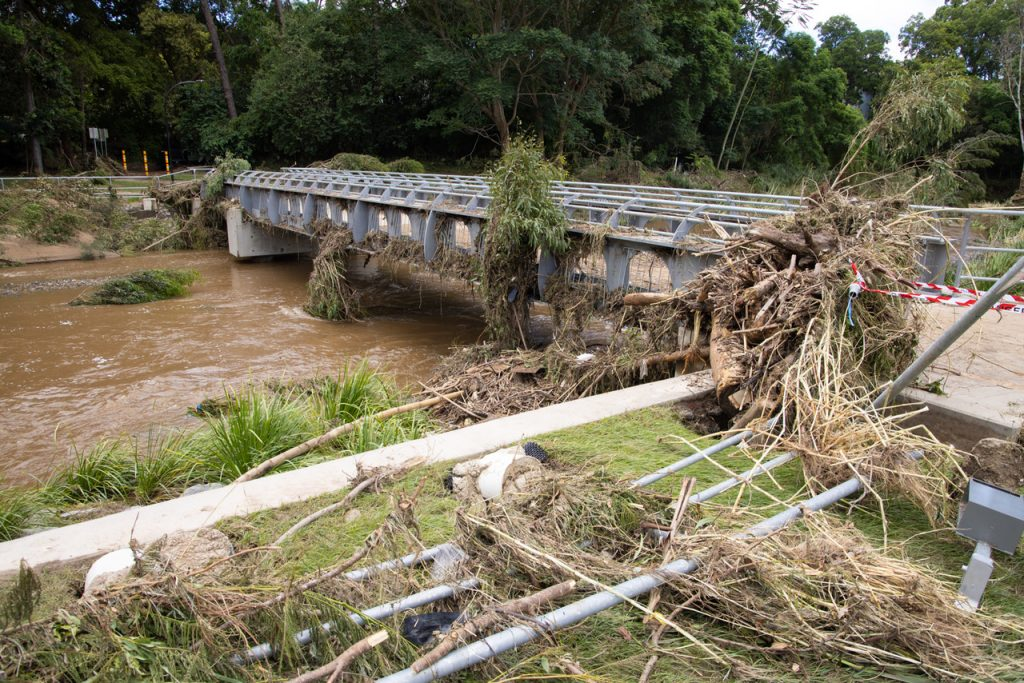
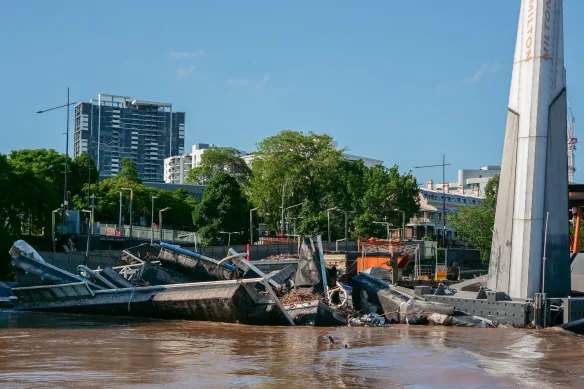
In February 1893, three separate floods hit Brisbane within weeks of each other, illustrating how successive events can occur within a single unpredictable wet season.[1] A tropical cyclone triggered extreme rainfall across the catchment, pushing the Brisbane River to an astonishing 8.35 metres at the City Gauge—the second-highest peak on record.

1893 Brisbane flood: boats on flooded Queen Street between multi-storey commercial buildings
Queen Street: floodwater through the CBD, with rowboats passing shopfronts still legible above the waterline.
1893 flood: submerged houses with only roofs and chimneys visible; figures on a raised bank in the foreground
Residential areas inundated to the eaves; observers on higher ground. Source: Queensland Historical Atlas.

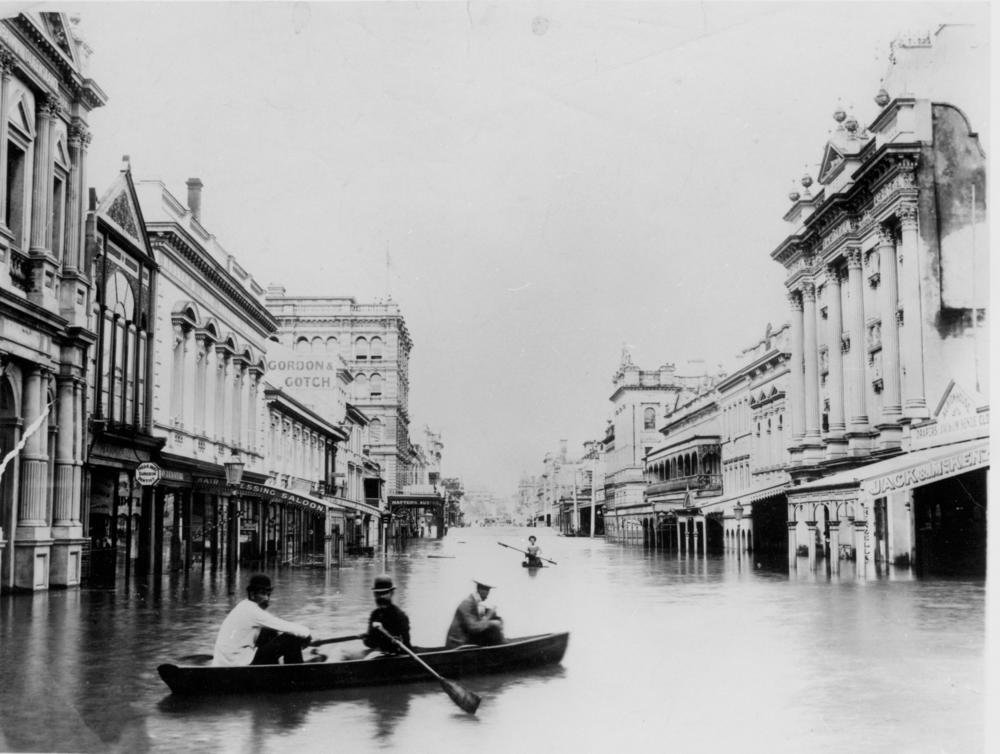
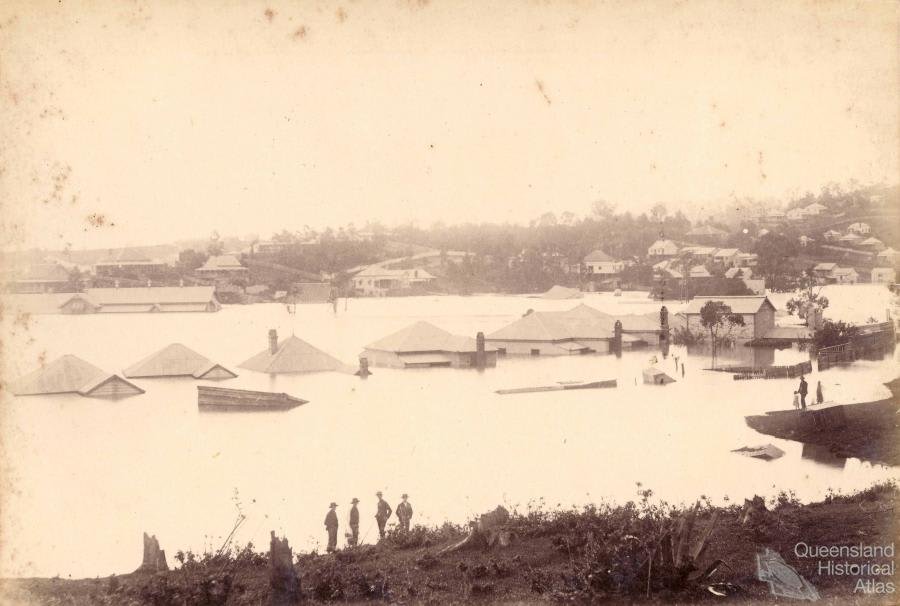
The sheer velocity of the water destroyed the Victoria Bridge and the Indooroopilly railway bridge. At least 11 people lost their lives, and the estimated damage was around £2,000,000—an extraordinary sum for the colonial era. During this event, Crohamhurst in the upper catchment recorded Australia's highest daily rainfall total to that date.

"In February 1893, three floods hit Brisbane within weeks of each other, illustrating how successive events can occur within one wet season." — Queensland Reconstruction Authority[1]

1974 — Cyclone Wanda

The End of Complacency

Before January 1974, an unusually wet spring had already saturated the vast Brisbane River catchment. When Cyclone Wanda arrived, it dragged a deeply unstable monsoonal trough over the region. Bureau of Meteorology records show a 5-day rainfall of 500–900 mm across the metropolitan area.

1974 Brisbane flood photograph 1 of 7: archival scene
1974 Brisbane flood photograph 2 of 7: widespread inundation
1974 Brisbane flood photograph 3 of 7: residential flooding
1974 Brisbane flood photograph 4 of 7: urban floodwaters
1974 Brisbane flood photograph 5 of 7: river and city flooding
1974 Brisbane flood photograph 6 of 7: street-level scene
1974 Brisbane flood photograph 7 of 7: Chelmer and the river

Archival view of flooding during Cyclone Wanda, January 1974.

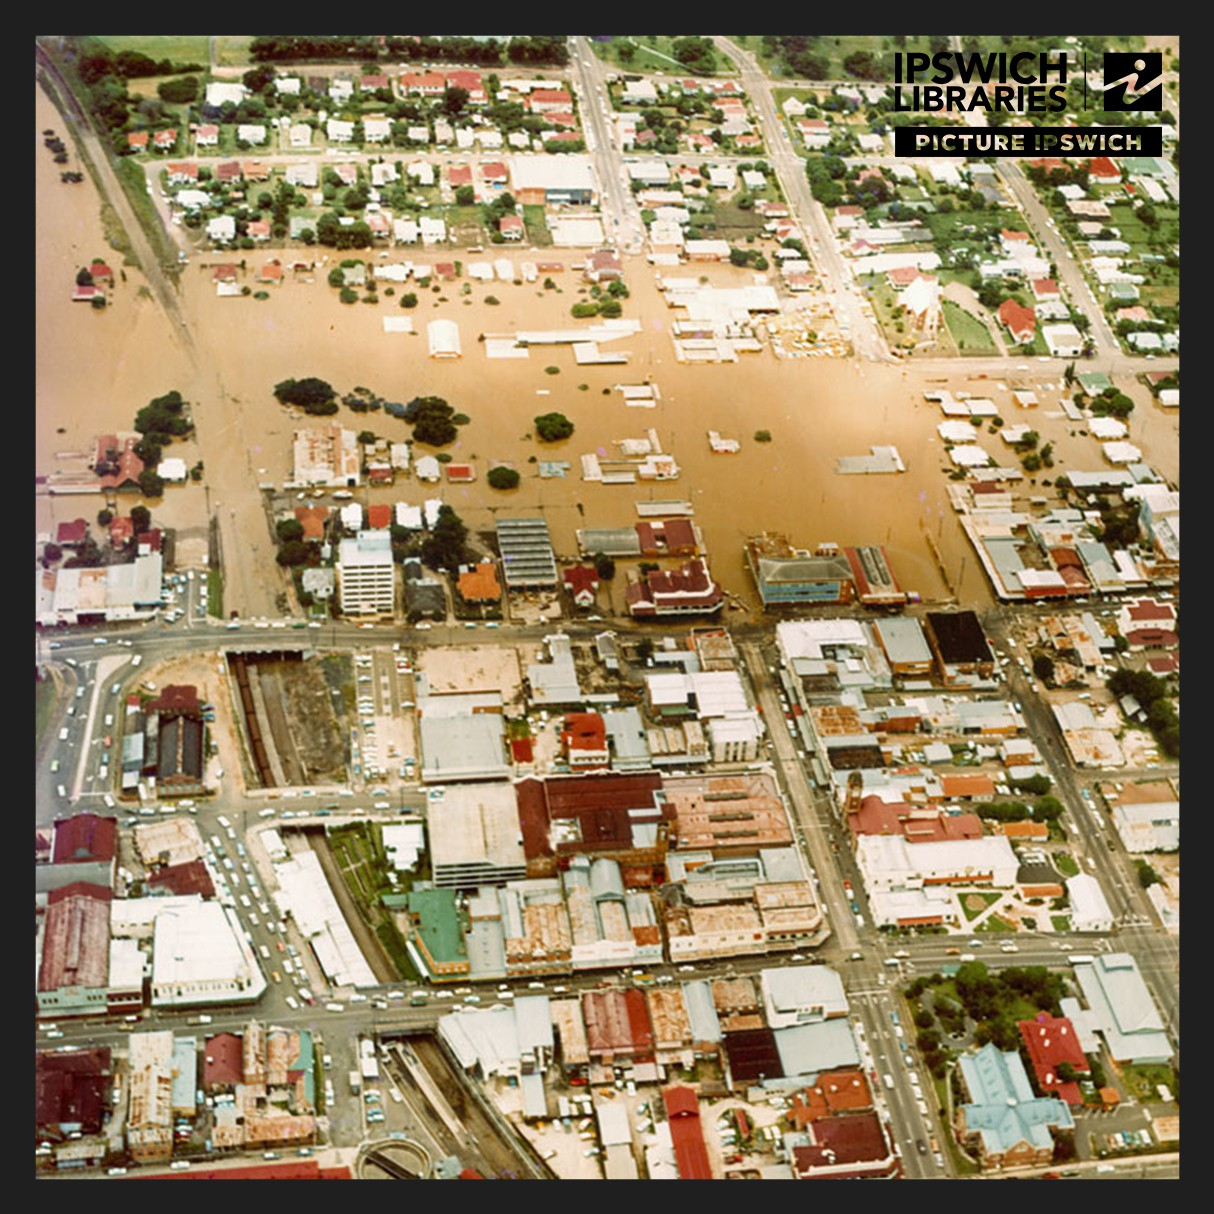
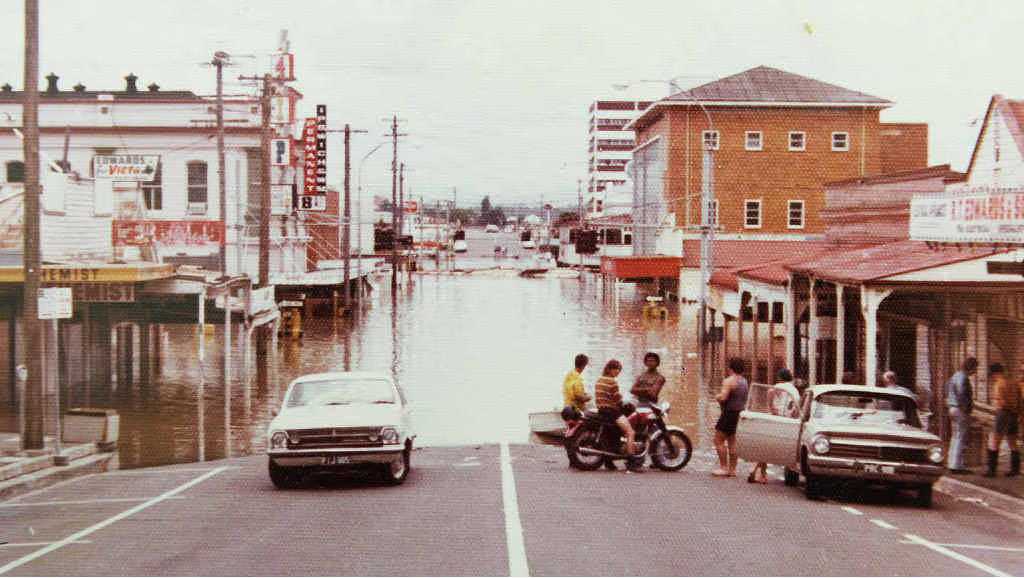
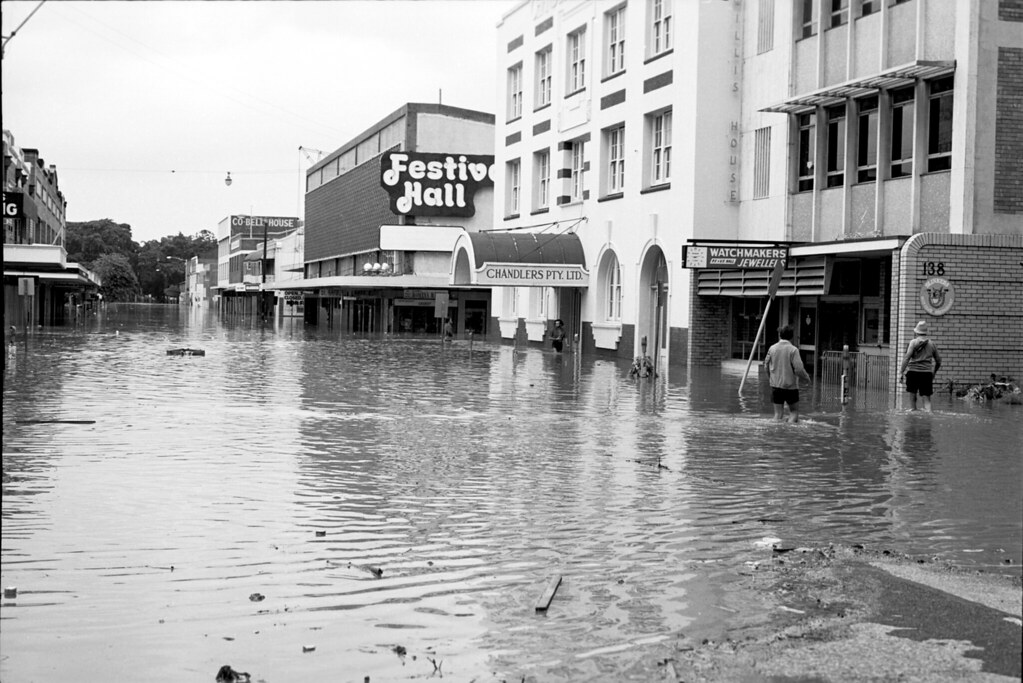
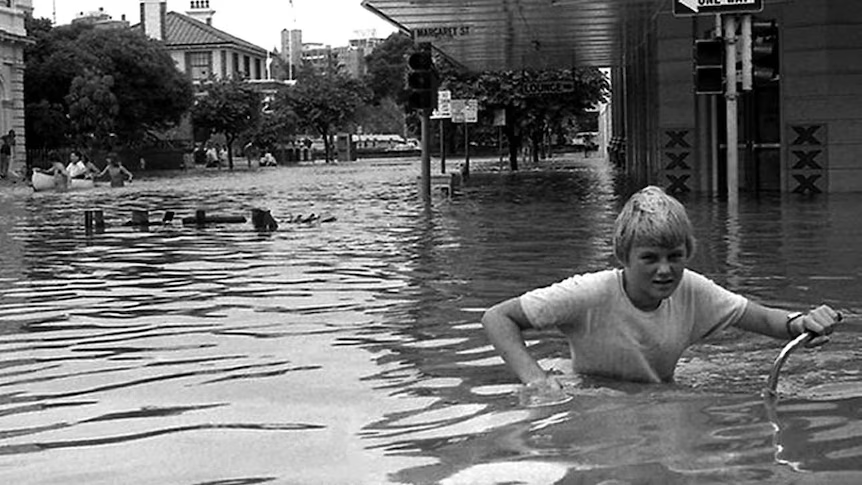
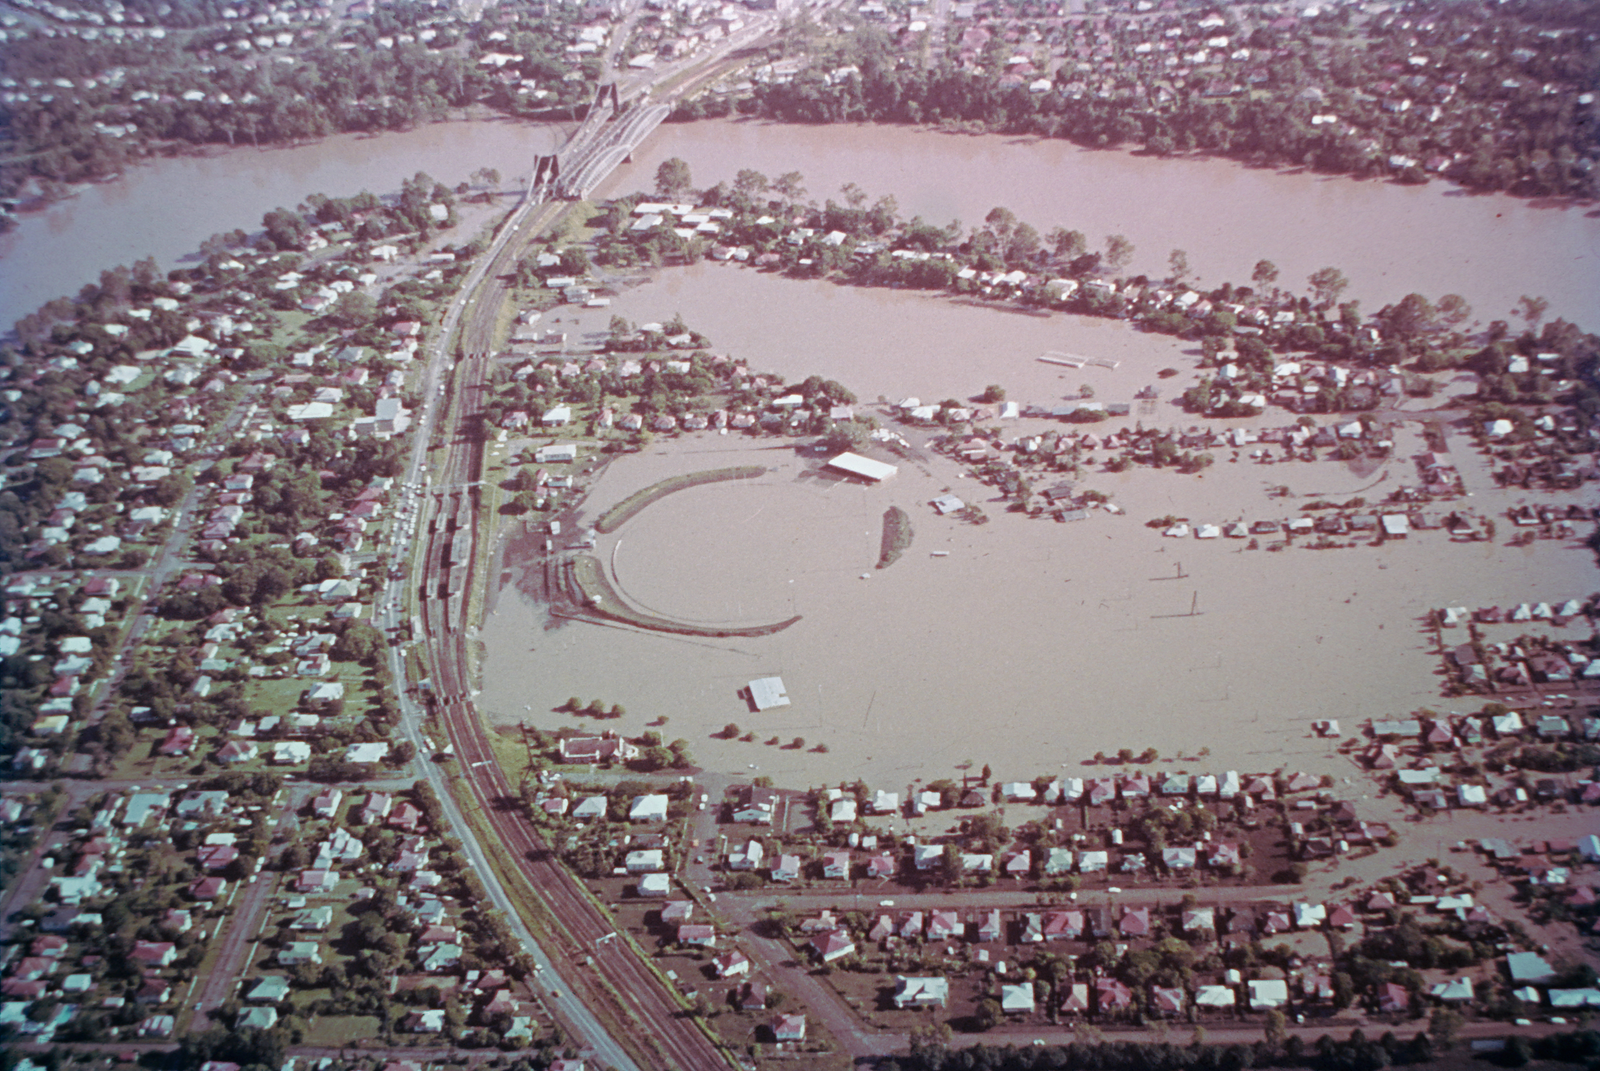
The river peaked at 5.45 metres, making it the largest flood to affect Brisbane in the twentieth century. Given the massive post-war expansion of the city onto the floodplain, the impact was unprecedented: approximately 8,500 homes were inundated.

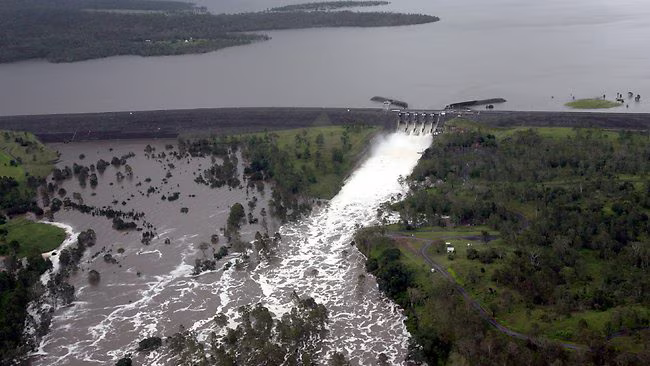
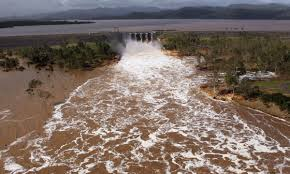
The trauma of 1974 sparked a political and engineering response that changed South East Queensland forever—chiefly, the commitment to build Wivenhoe Dam.


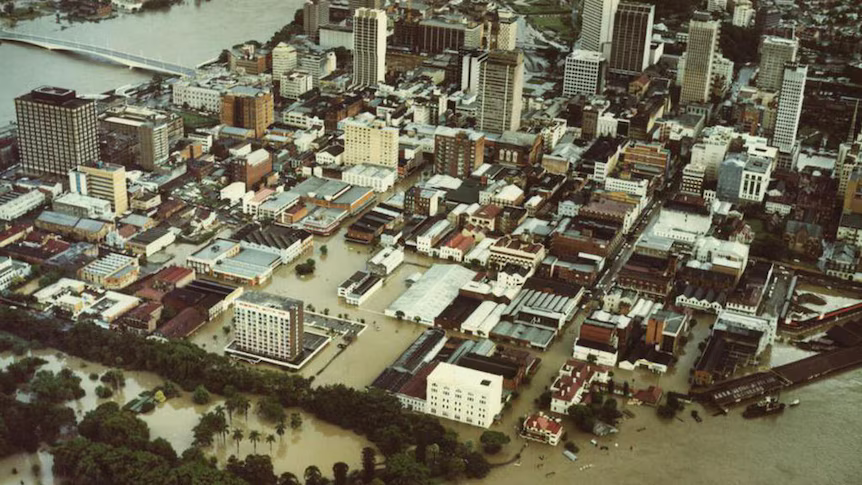
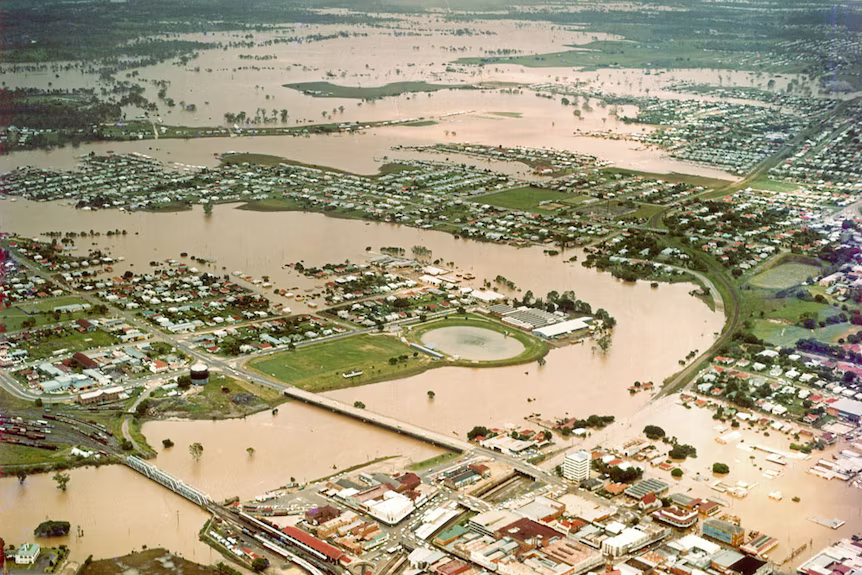
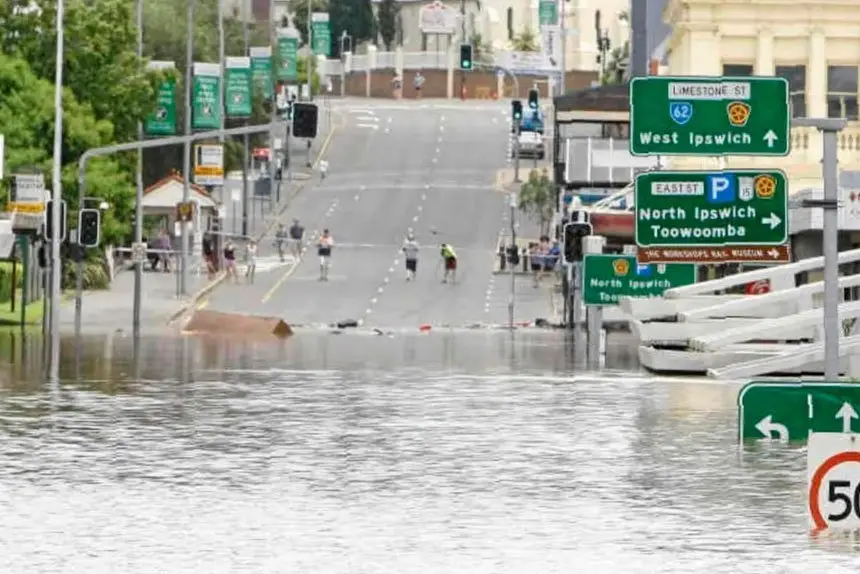
2010–2011 — The Inland Sea

A State Built on Water

The 2010–2011 floods were not a single storm, but a season of accumulating disaster. Driven by a very strong La Niña, month after month of rainfall saturated every catchment in Queensland. By January, an astonishing 75% of the state was officially disaster-declared.

2010–11 Queensland floods photograph 1 of 20: Brisbane river flooding
2010–11 Queensland floods photograph 2 of 20: documentary scene
2010–11 Queensland floods photograph 3 of 20: South Bank and Wheel
2010–11 Queensland floods photograph 4 of 20: published graphic
2010–11 Queensland floods photograph 5 of 20: Toowoomba flash flood
2010–11 Queensland floods photograph 6 of 20: Toowoomba flash flooding
2010–11 Queensland floods photograph 7 of 20: widespread flooding
2010–11 Queensland floods photograph 8 of 20: flood extent
2010–11 Queensland floods photograph 9 of 20: documentary view
2010–11 Queensland floods photograph 10 of 20: infrastructure and water
2010–11 Queensland floods photograph 11 of 20: elevated view
2010–11 Queensland floods photograph 12 of 20: residential flooding
2010–11 Queensland floods photograph 13 of 20: street-level flooding
2010–11 Queensland floods photograph 14 of 20: river and city
2010–11 Queensland floods photograph 15 of 20: documentary scene
2010–11 Queensland floods photograph 16 of 20: roads and properties
2010–11 Queensland floods photograph 17 of 20: inundation
2010–11 Queensland floods photograph 18 of 20: urban flooding
2010–11 Queensland floods photograph 19 of 20: documentation image
2010–11 Queensland floods photograph 20 of 20: overview

Brisbane River flooding across the city reach, January 2011.

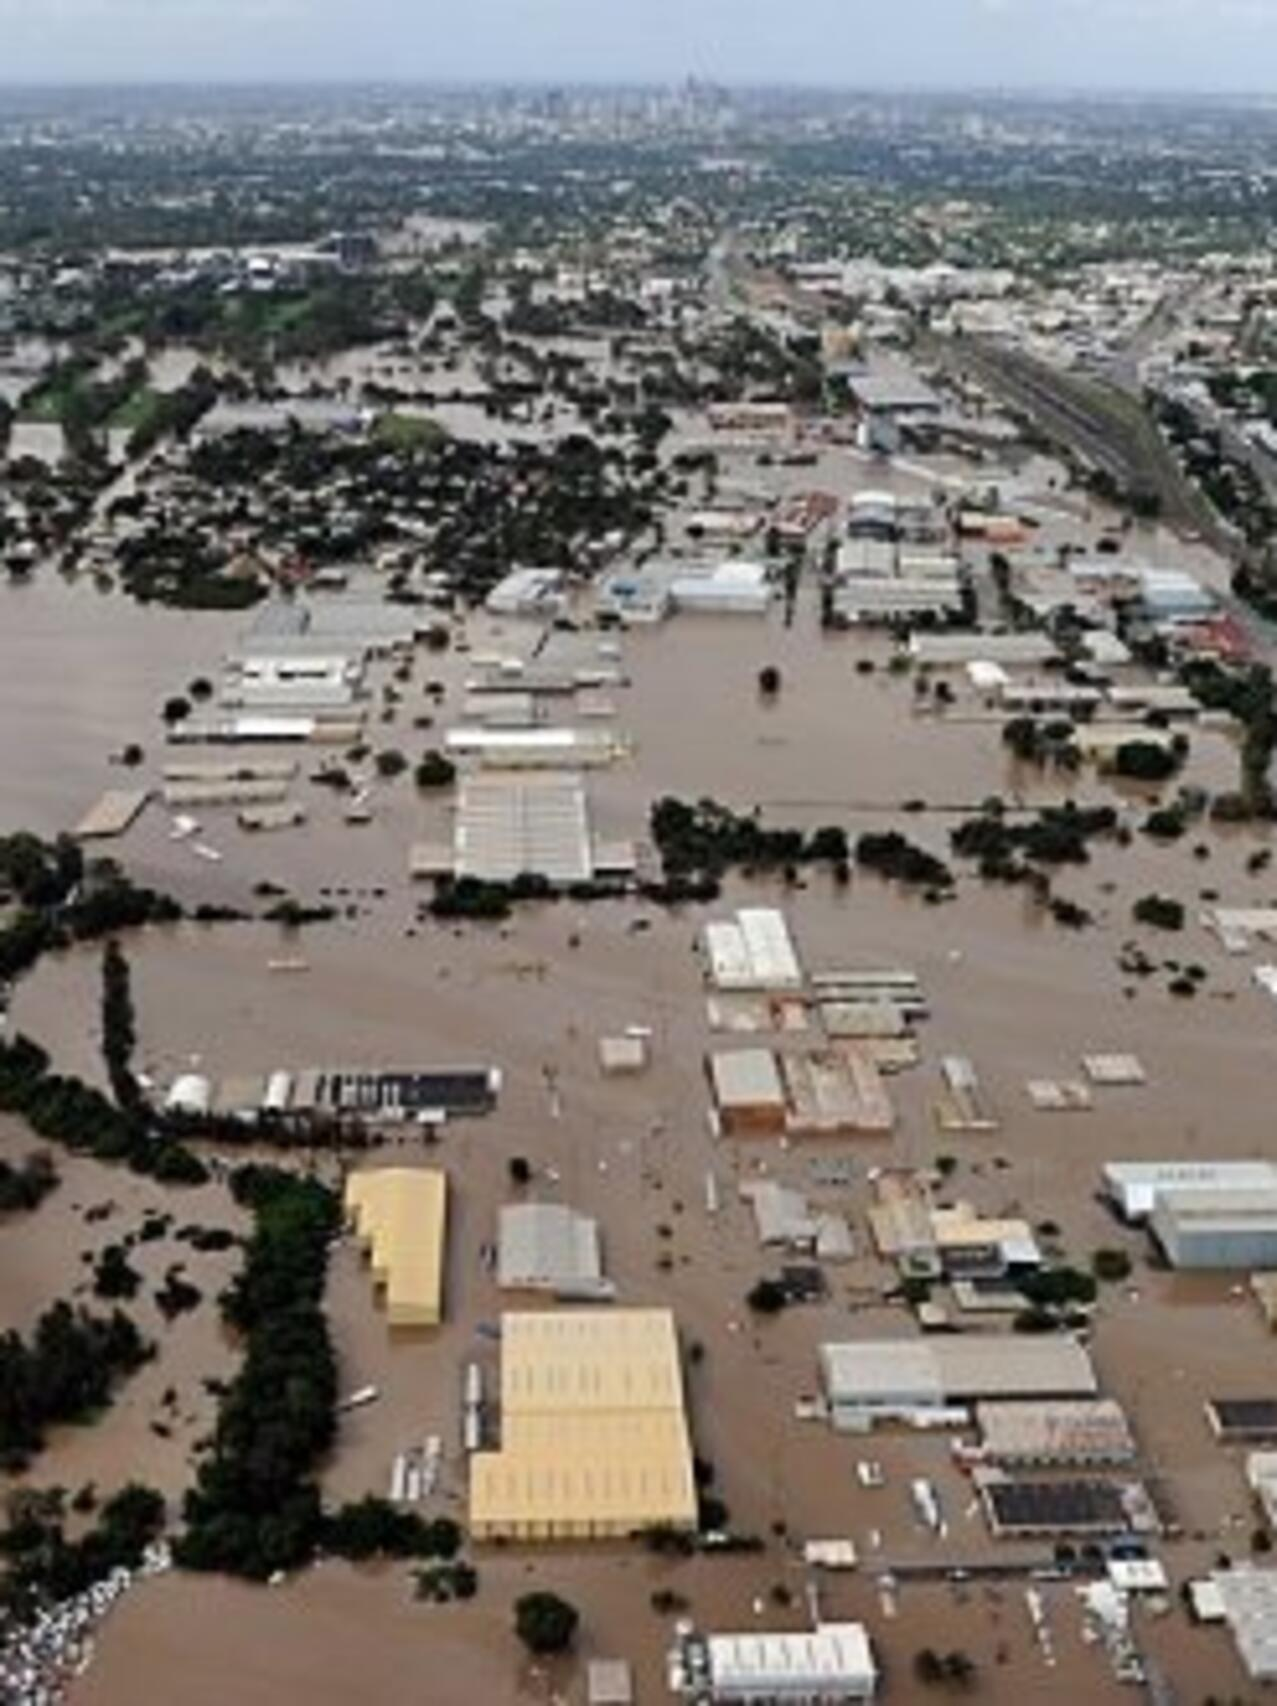
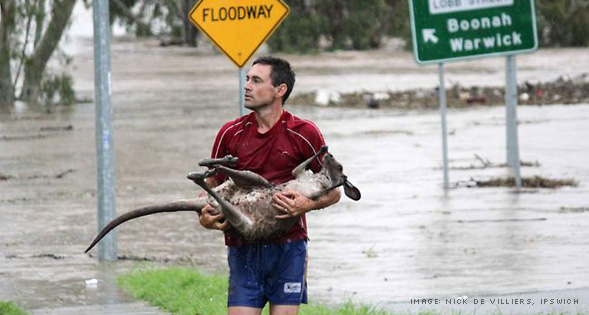
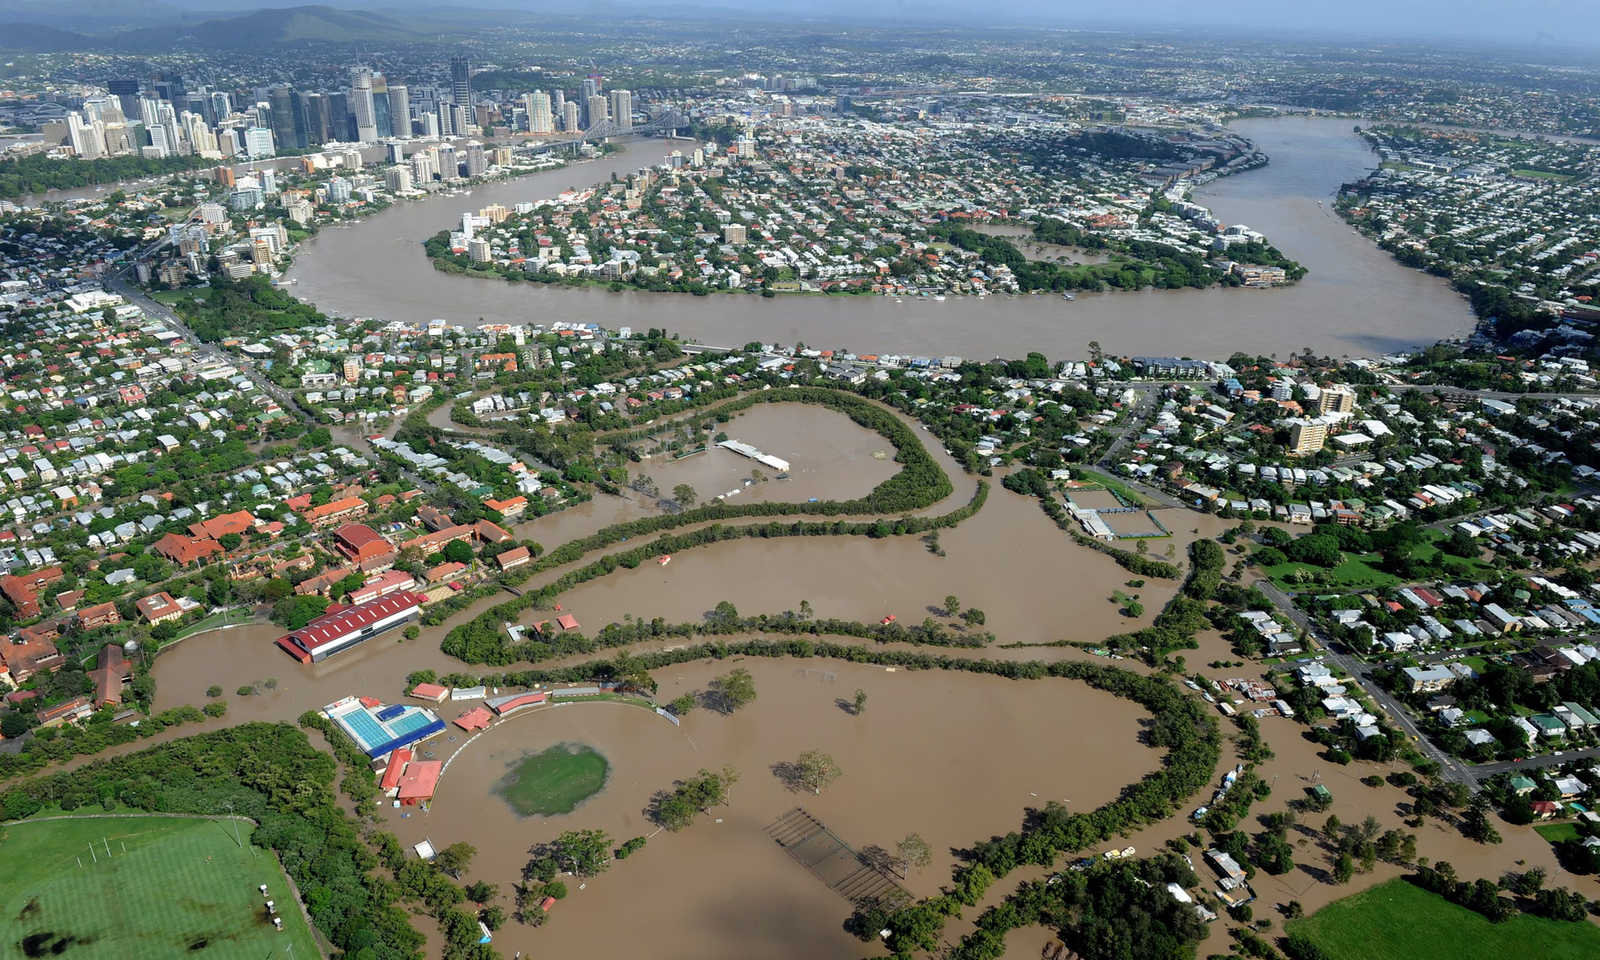
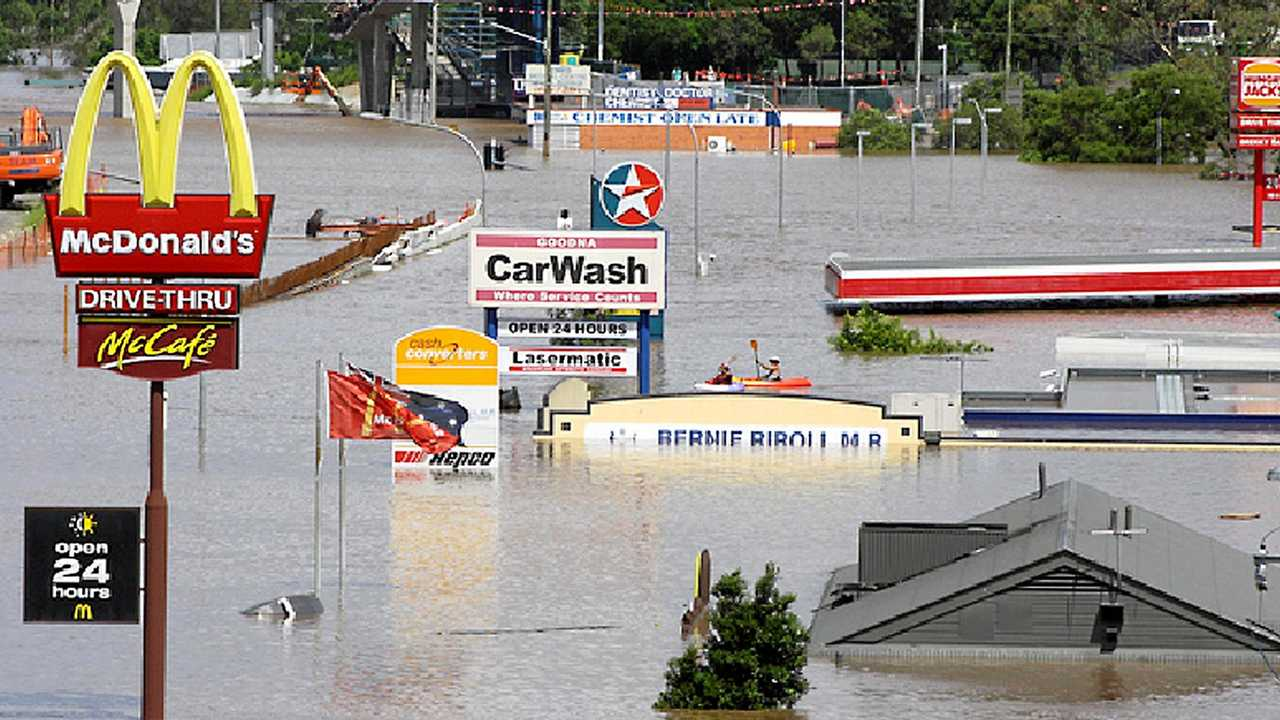
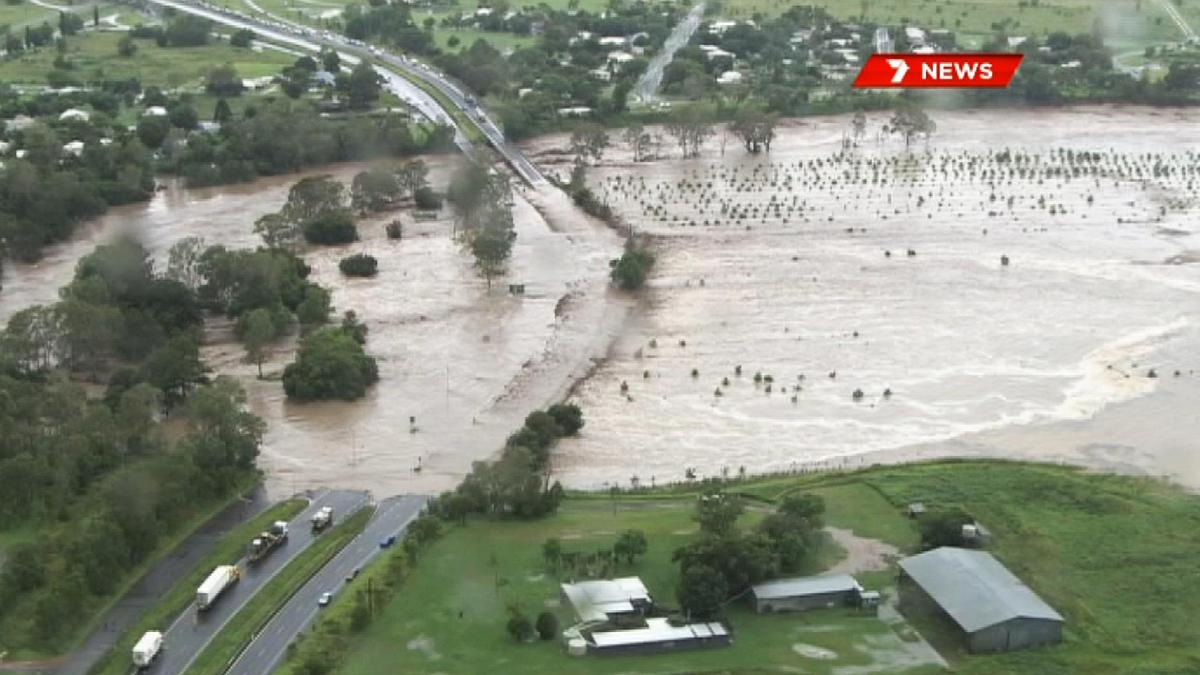
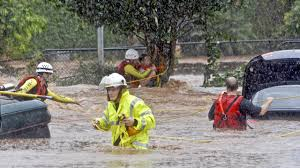
When the Brisbane River finally peaked at 4.46 metres in mid-January, the economic damage was staggering. 12,500 properties were inundated in Brisbane alone. A World Bank assessment put the total economic damages at roughly US$15.9 billion. Tragic loss of life occurred, particularly during the terrifying flash flooding events in the Lockyer Valley that preceded the main river peak.[3]

format_quote
"The 2010–11 Queensland floods were described at the time as Australia's costliest natural disaster in modern memory, rippling through the national economy."
Deloitte Access Economics 2022 SEQ Flood Report

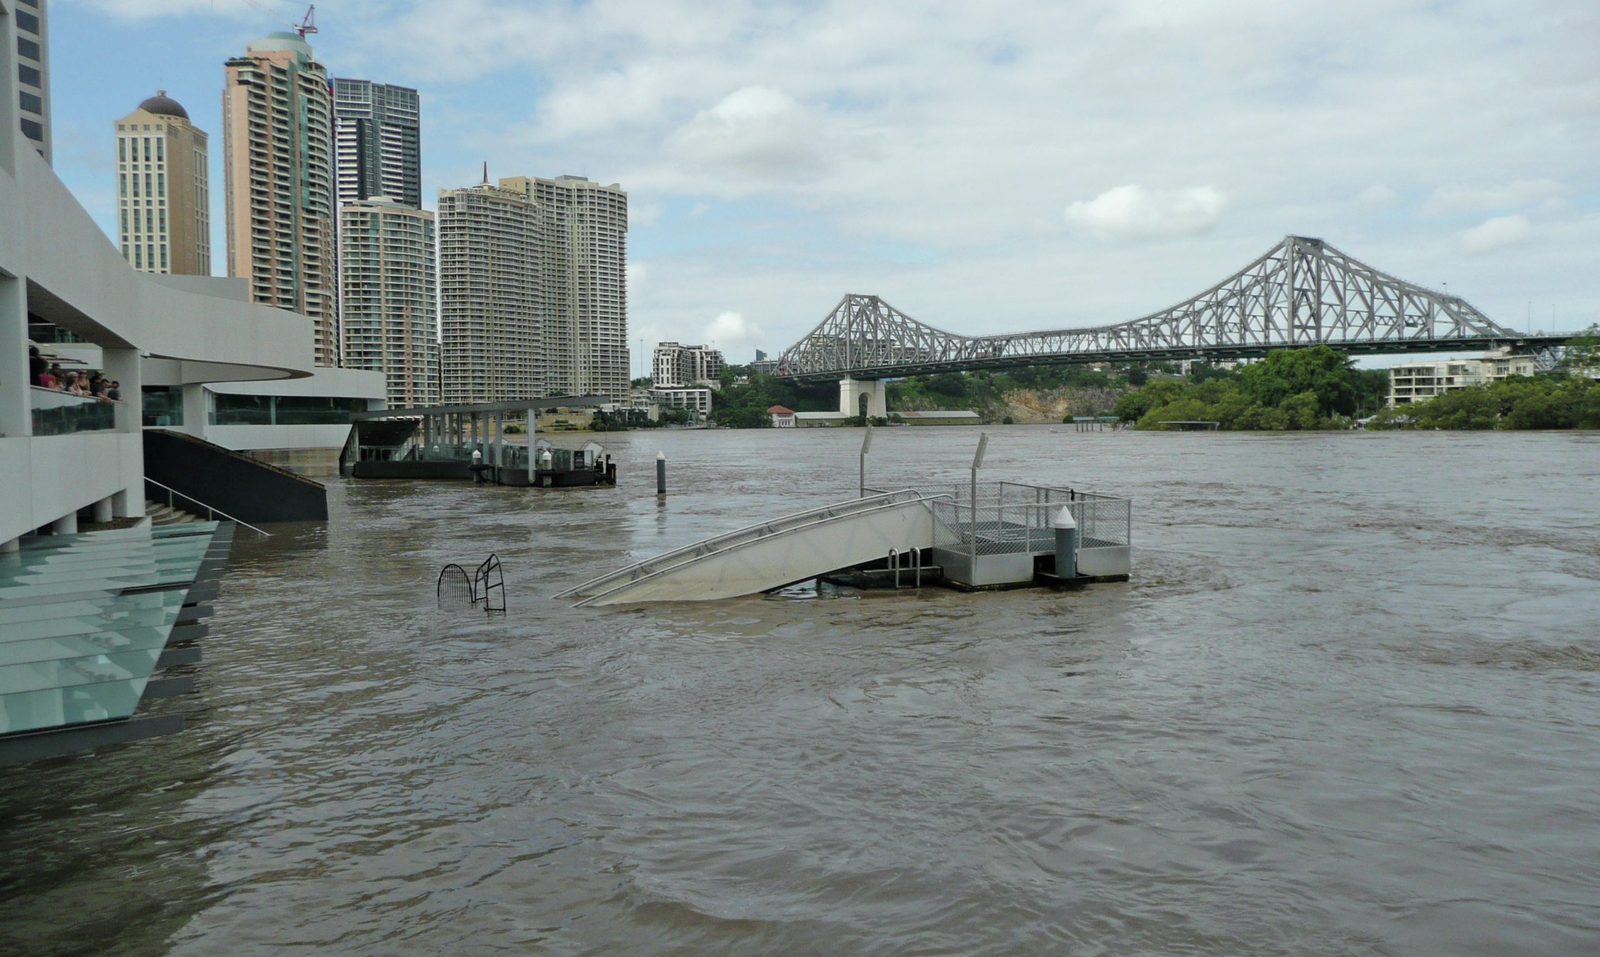
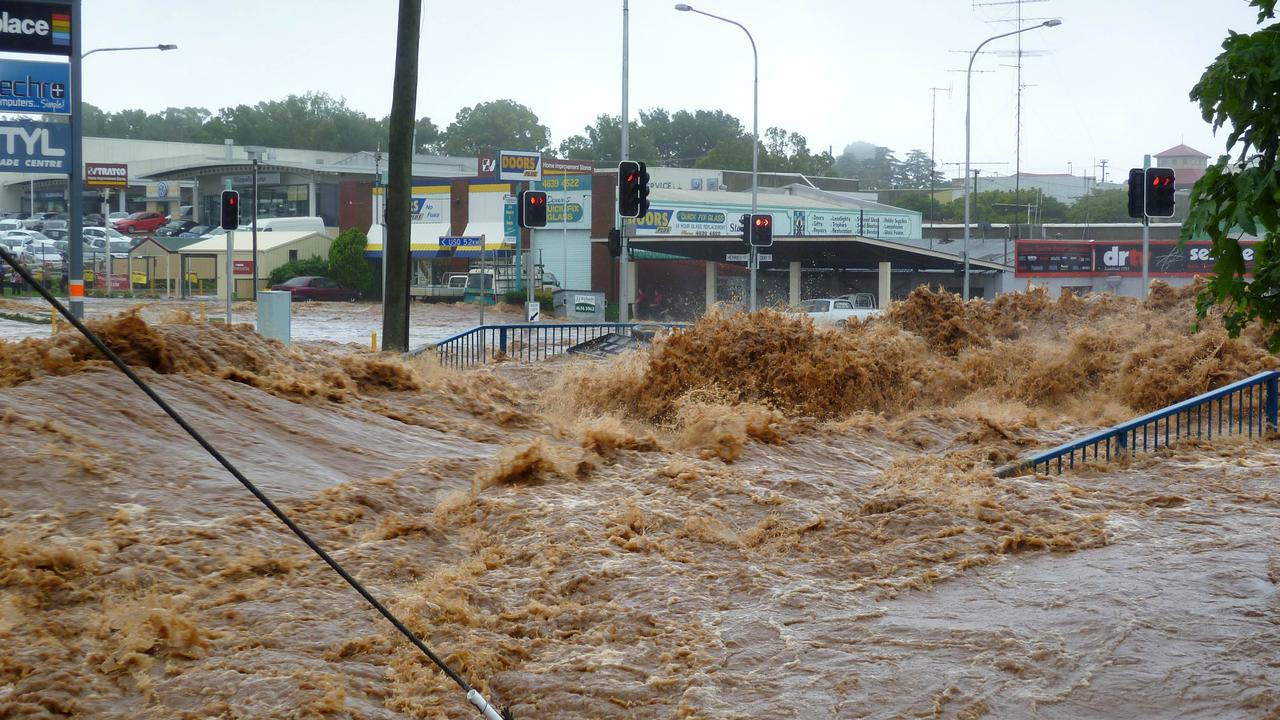
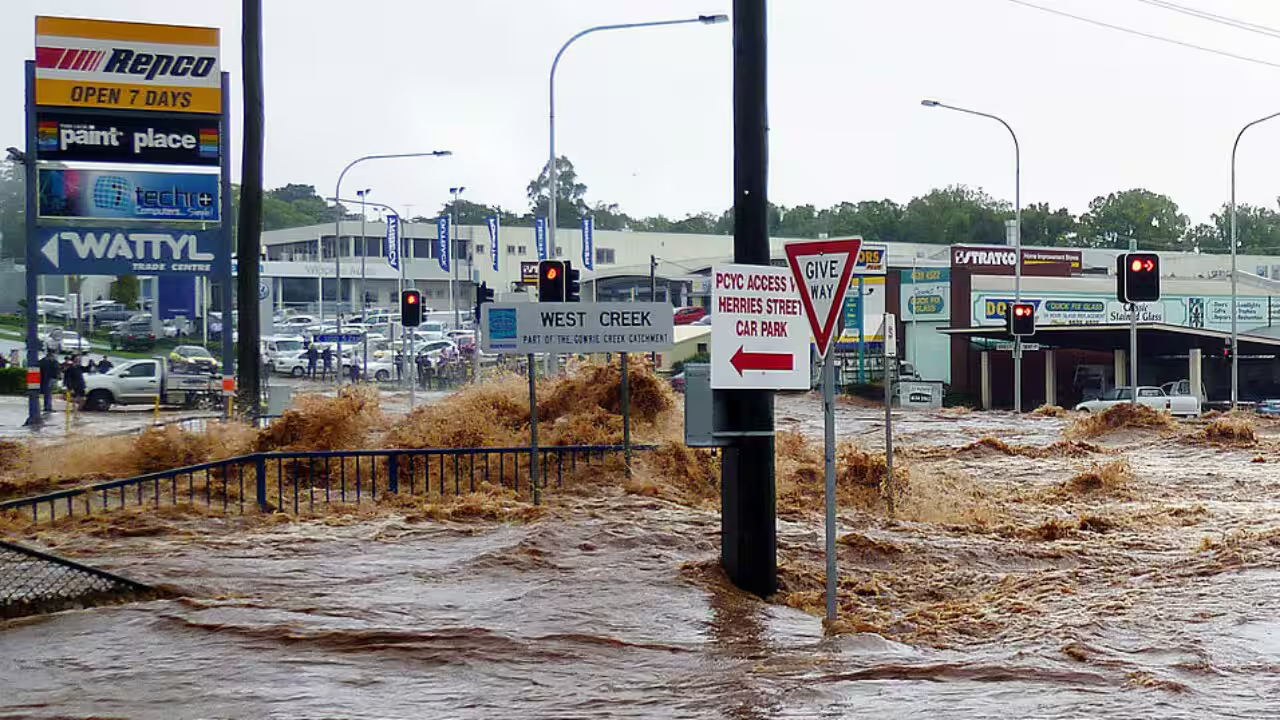
2022 — The Rain Bomb

The Compound Threat

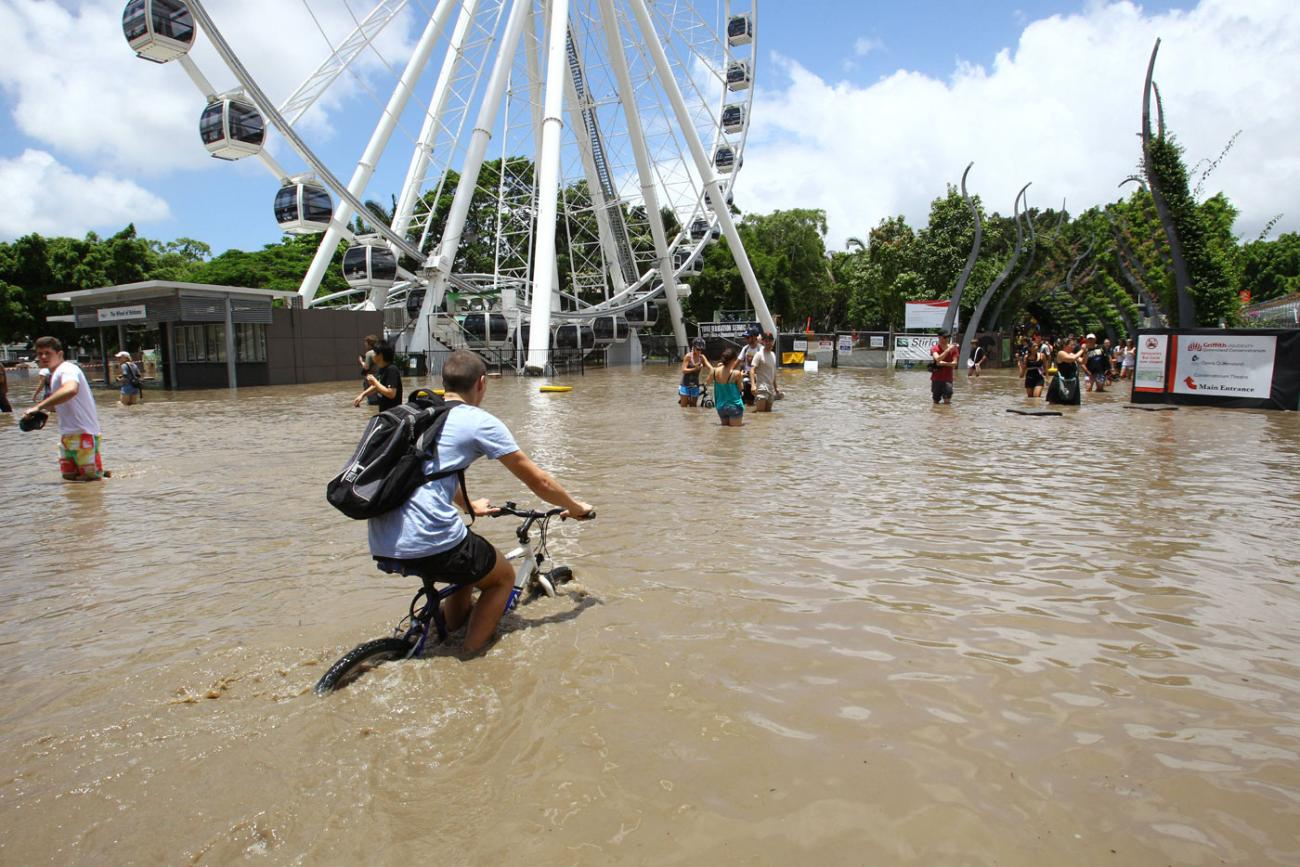
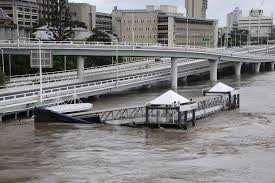
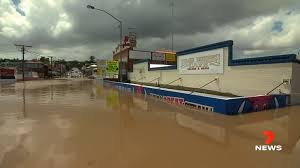
In late February 2022, an atmospheric block trapped a severe weather system over South East Queensland. Over three days, the Brisbane local government area received an average of 795 mm of rain—some suburbs received over a metre. It became the city's second-wettest month on record, yielding a record-breaking 4-day catchment-average rainfall of 444.6 mm.

2022 SEQ floods photograph 1 of 14: Brisbane flooding
2022 SEQ floods photograph 2 of 14: Queensland flood conditions
2022 SEQ floods photograph 3 of 14: Enoggera Creek flooding
2022 SEQ floods photograph 4 of 14: Ipswich flooding
2022 SEQ floods photograph 5 of 14: flood debris and damage
2022 SEQ floods photograph 6 of 14: street-level flooding
2022 SEQ floods photograph 7 of 14: roads and properties underwater
2022 SEQ floods photograph 8 of 14: documentary scene
2022 SEQ floods photograph 9 of 14: infrastructure and homes
2022 SEQ floods photograph 10 of 14: metropolitan inundation
2022 SEQ floods photograph 11 of 14: neighbourhood flood extent
2022 SEQ floods photograph 12 of 14: wide flood view
2022 SEQ floods photograph 13 of 14: overland flow
2022 SEQ floods photograph 14 of 14: documentation image

Brisbane metropolitan area during the February 2022 rain event.

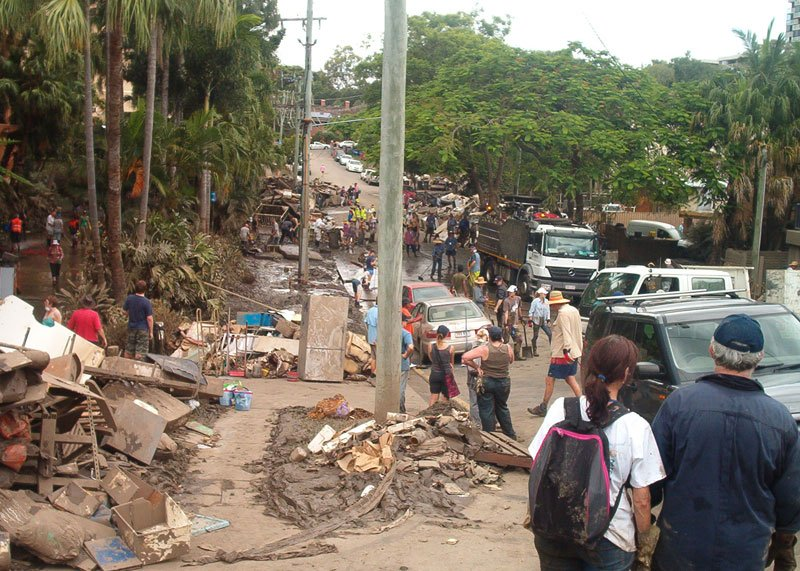
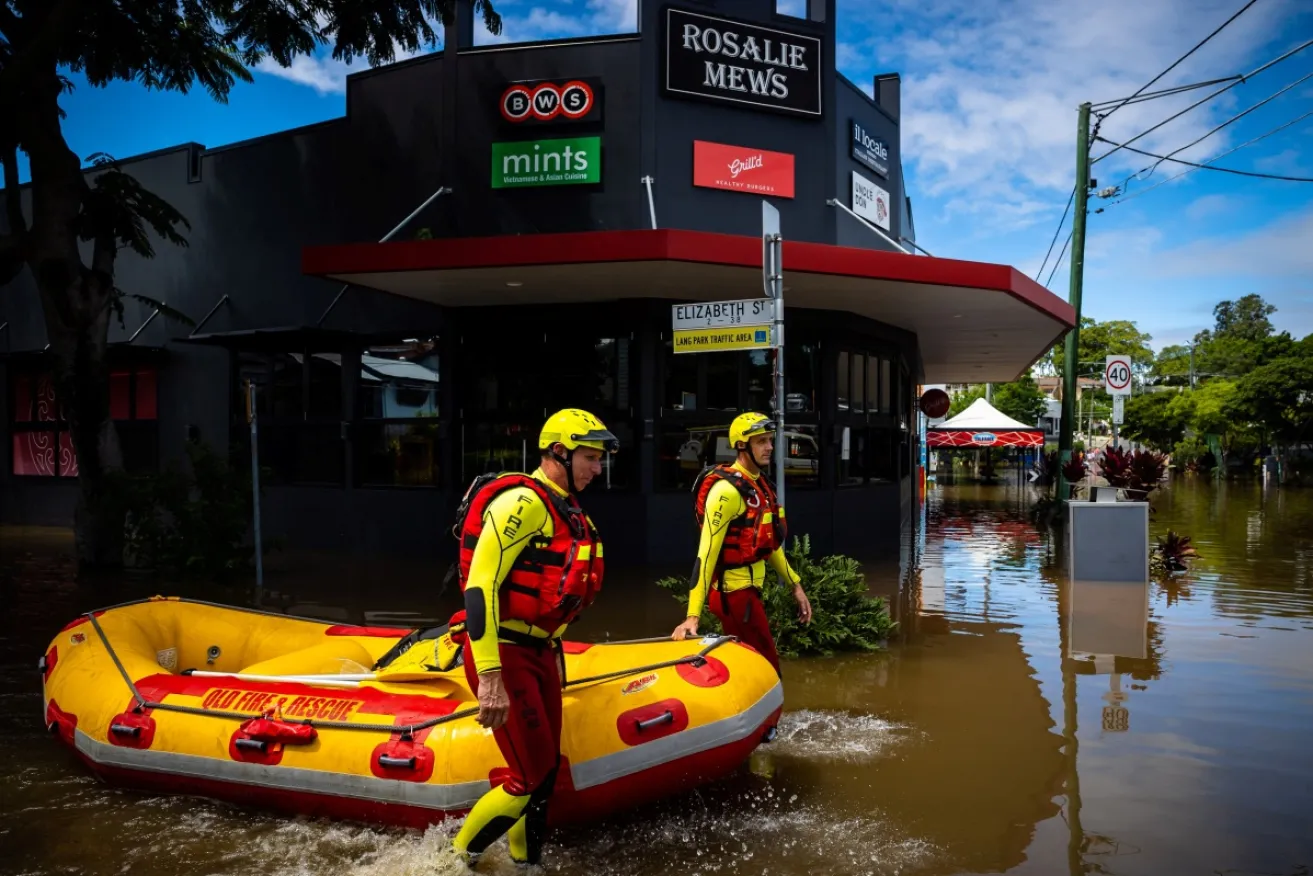
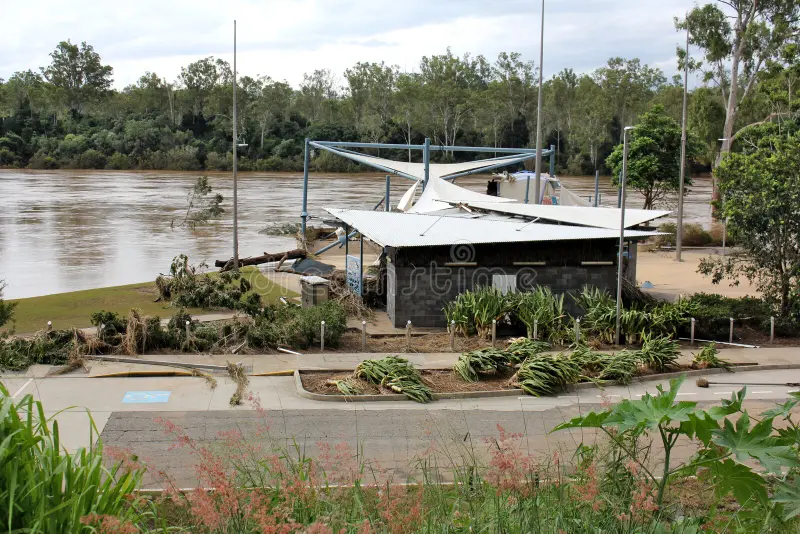
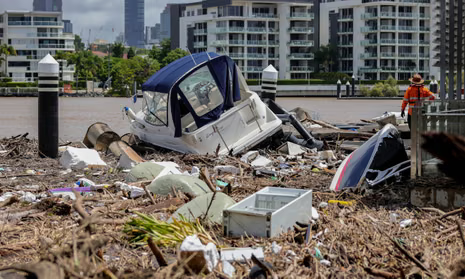
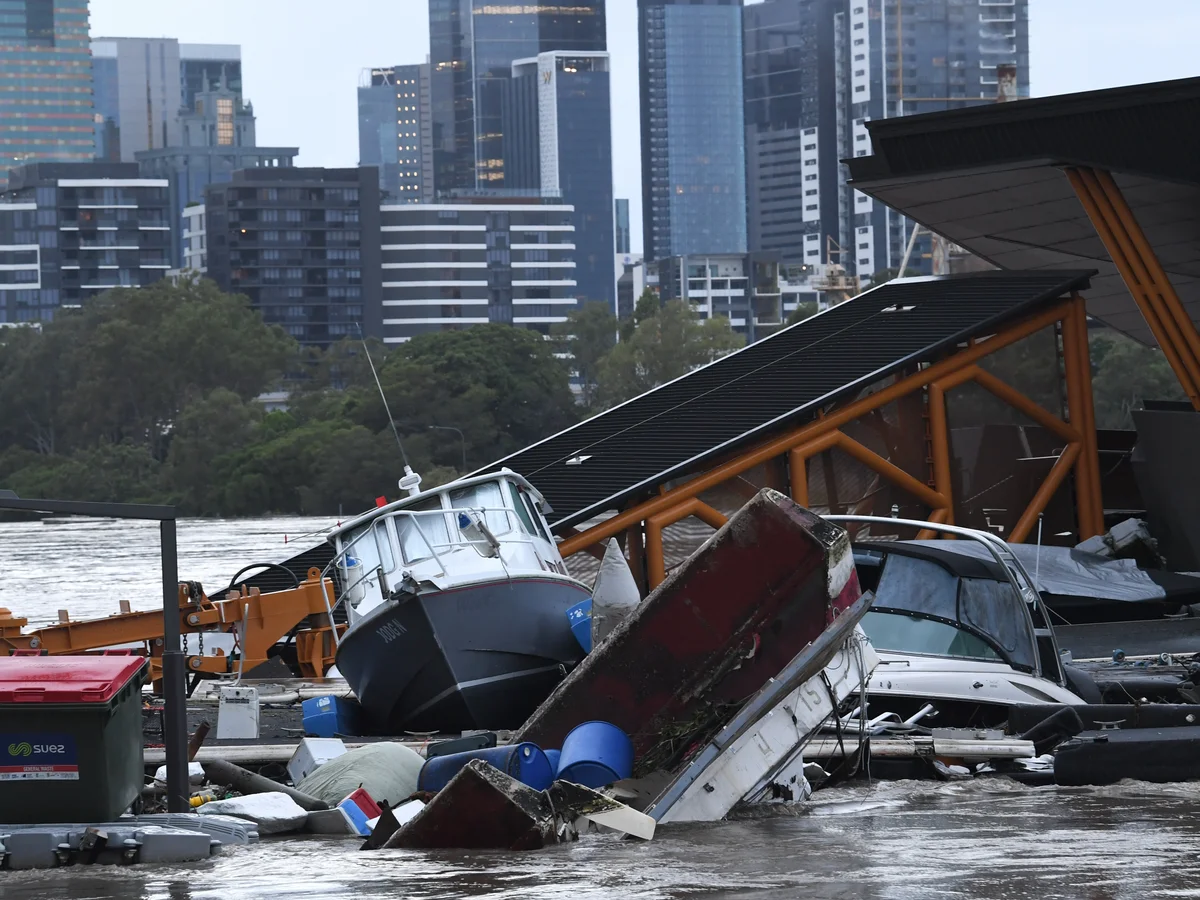
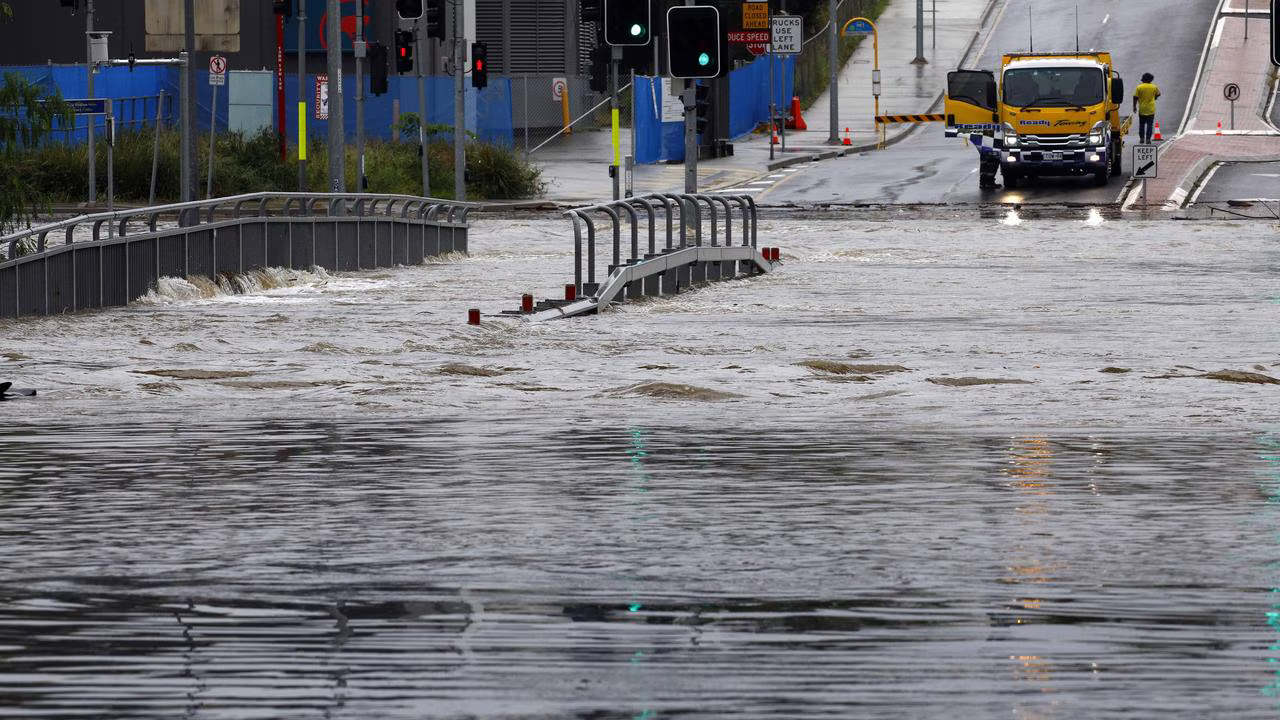
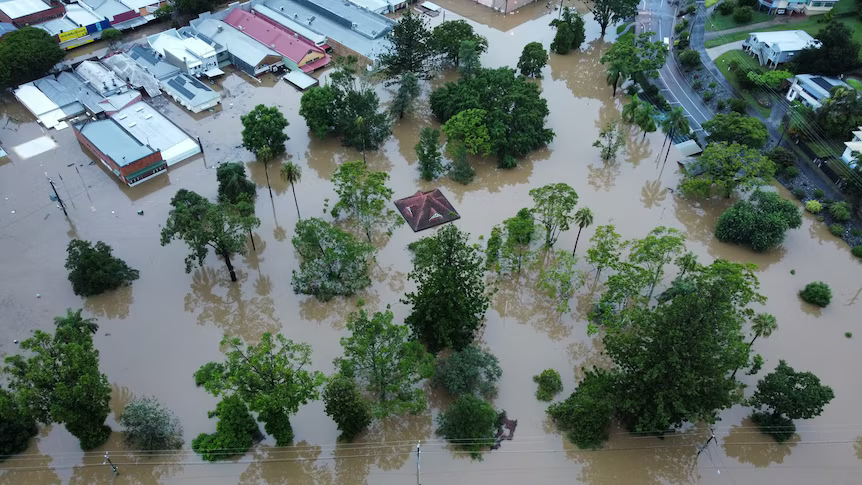
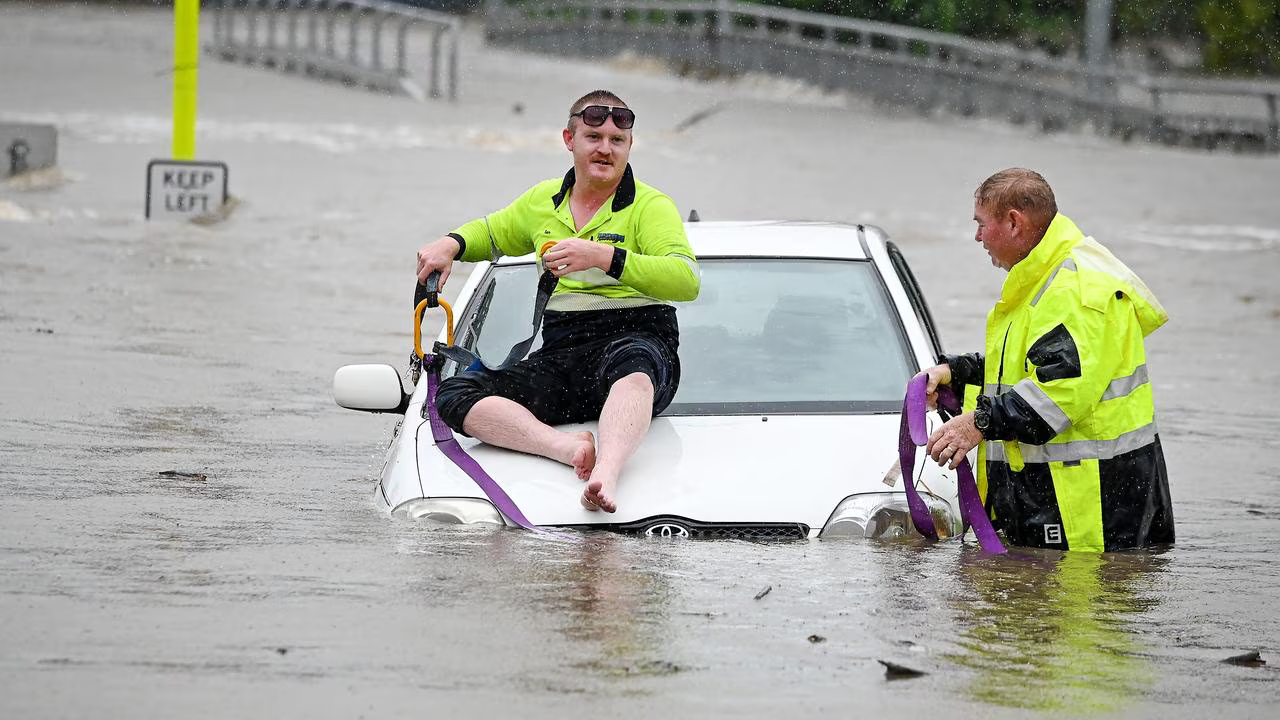
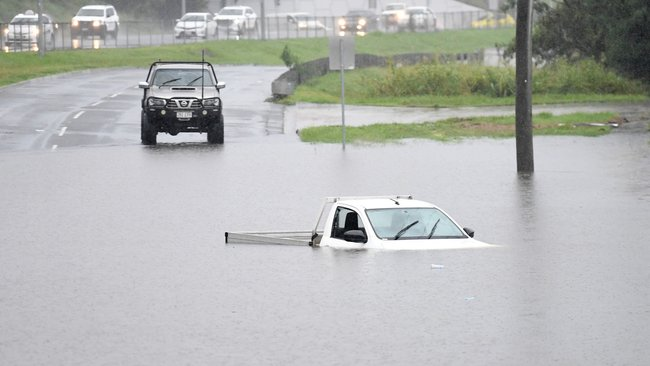
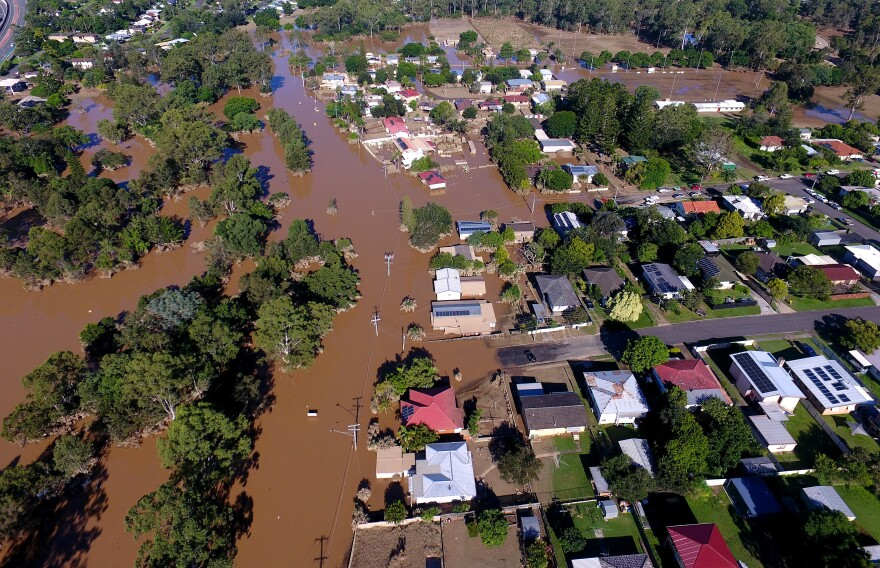
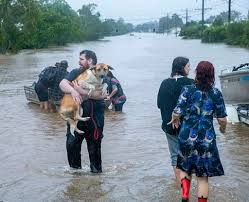
The Brisbane River city gauge peaked at 3.85 metres—lower than 2011. Yet, because of compound flooding (the simultaneous combination of river flooding, intense creek flooding, and overland stormwater flow), over 23,400 properties were affected. It flooded more properties than any event since 1974.

"Peak river height alone is a misleading indicator of total community impact. The 2022 floods demonstrated that creek flooding and overland flow can be just as devastating as riverine inundation." — Griffith University analysis, 2023[4]

References

  1. Queensland Reconstruction Authority. (2019). Brisbane River Catchment Historical Factsheet.
  2. Bureau of Meteorology. (1975). Brisbane Floods January 1974 Report.
  3. World Bank. (2012). The World Bank Queensland Floods Assessment. Document Bank.
  4. Griffith University. (2023). Why was Brisbane's 2022 flood different? Griffith News.